
The ICOM (Inputs, Controls, Outputs, and Mechanisms) diagram is a crucial tool in system engineering and modeling. It visually represents the relationships between different components of a system, clarifying how inputs are transformed into outputs under specific controls and using defined mechanisms. This article provides a comprehensive guide to understanding and utilizing Icom Diagrams.
What is an ICOM Diagram?
An ICOM diagram, also known as an Input-Control-Output-Mechanism diagram, is a structured analysis technique used to depict the functional elements of a system. It illustrates how inputs are processed into outputs, highlighting the controls that govern the process and the mechanisms that enable it. Each element is represented by a specific symbol and connected by arrows indicating the flow of information and action. This visual representation makes it easier to analyze complex systems and understand their inner workings. ICOM diagrams are often utilized in conjunction with other system modeling techniques.
Key Components of an ICOM Diagram
ICOM diagrams consist of four primary components:
1. Inputs:
Inputs represent anything that enters the system to be processed. These can be physical materials, data, energy, or signals. In an ICOM diagram, inputs are typically depicted as arrows pointing towards the left side of a function block.
2. Controls:
Controls represent the factors that regulate or influence the transformation process. They can be rules, constraints, parameters, or feedback loops. Controls are usually shown as arrows pointing downwards from the top of a function block.
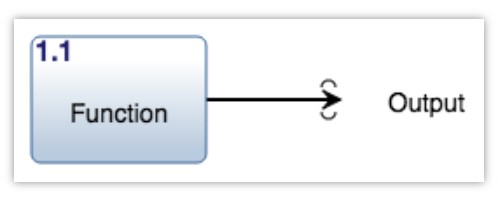
3. Outputs:
Outputs represent the results of the system’s processing of inputs. These can be finished products, processed data, or changed states. Outputs are represented as arrows pointing outwards from the right side of a function block.
4. Mechanisms:
Mechanisms represent the means by which the system transforms inputs into outputs. These are the physical components, processes, or algorithms that perform the work. Mechanisms are typically illustrated as arrows pointing upwards to the bottom of a function block.
Creating and Using ICOM Diagrams
Creating an ICOM diagram involves identifying the core function of the system and then systematically breaking it down into its constituent inputs, controls, outputs, and mechanisms. Software tools like Innoslate can facilitate this process, providing features to create and manipulate diagram elements.
When using ICOM diagrams, consider the following:
- Clarity and Simplicity: Keep the diagram clean and easy to understand. Use clear labels and avoid unnecessary complexity.
- Completeness: Ensure all relevant inputs, controls, outputs, and mechanisms are included.
- Consistency: Maintain a consistent style and notation throughout the diagram.
- Context: Provide sufficient context to understand the purpose and scope of the diagram.
Benefits of Using ICOM Diagrams
ICOM diagrams provide several benefits in system modeling and analysis:
- Improved Understanding: Visualizing system components and their relationships enhances comprehension.
- Enhanced Communication: Facilitates clear communication among stakeholders.
- Early Problem Detection: Helps identify potential issues and bottlenecks in the system design.
- Systematic Analysis: Provides a structured approach to analyze complex systems.
- Basis for Design and Development: Serves as a foundation for system design and development activities.
Conclusion
The ICOM diagram is a valuable tool for anyone involved in system engineering, analysis, or design. By providing a clear visual representation of system components and their interactions, it enables a deeper understanding of how systems function and facilitates effective communication among stakeholders. Mastering the use of ICOM diagrams can significantly improve the efficiency and effectiveness of system development processes. Utilizing specialized software can further enhance the creation and management of these diagrams.